VWAP Day Trading Strategy: How Institutions Use It
⚡ Key Takeaways
- VWAP (Volume Weighted Average Price) represents the average price a stock has traded at throughout the day, weighted by volume
- Institutional traders use VWAP as a benchmark — buying below VWAP is considered a
- for large orders
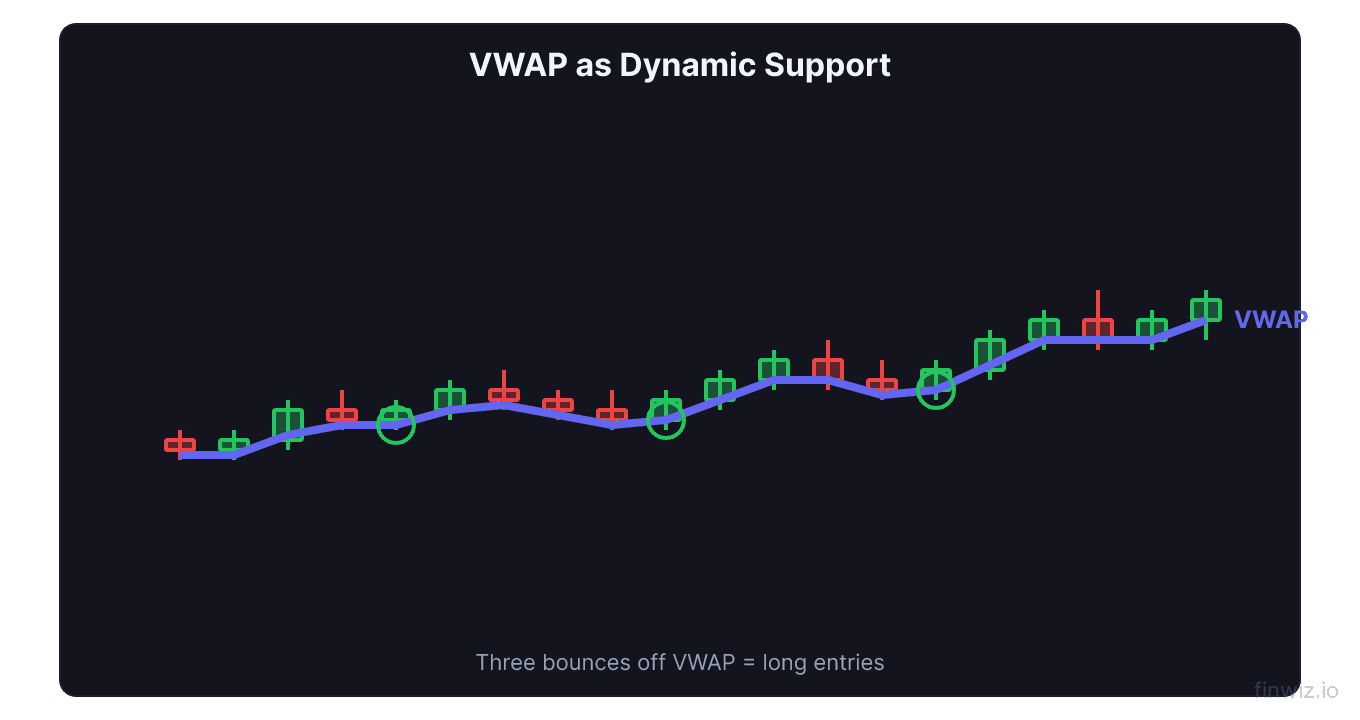
- The VWAP bounce strategy enters long when the price pulls back to VWAP and bounces with volume confirmation
- The VWAP break strategy enters short (or avoids longs) when the price falls below VWAP with conviction
- VWAP resets daily and is most effective during the regular trading session with sufficient volume
What Is VWAP?
VWAP (Volume Weighted Average Price) is a trading benchmark that calculates the average price at which a security has traded throughout the day, weighted by the volume at each price level. It is one of the most important indicators for intraday traders because it reveals where the majority of volume has transacted.
Unlike a simple moving average that only considers price, VWAP gives more weight to price levels where heavy volume occurred. If a stock traded 1 million shares at $50 and only 100,000 shares at $55, VWAP would be much closer to $50 than to $55, reflecting where the real institutional activity happened.
VWAP = Σ (Price × Volume) / Σ VolumeVWAP resets at the start of each trading day. It is a purely intraday indicator and carries no information from previous sessions. By the end of the trading day, VWAP represents the true average price that all participants paid for the stock that day.
Why Institutional Traders Care About VWAP
Understanding why VWAP matters to institutional traders is critical because their behavior around VWAP creates the predictable patterns that retail traders can exploit.
When a mutual fund or pension fund needs to buy or sell a large block of shares, they benchmark their execution against VWAP. A fund manager who bought shares at an average price below VWAP achieved a better-than-average execution. A manager who bought above VWAP overpaid relative to the market.
This means institutional traders actively attempt to buy below VWAP and sell above VWAP. When a stock pulls back to VWAP during an uptrend, institutional buyers step in, creating a bounce. When a stock rallies to VWAP during a downtrend, institutional sellers step in, creating resistance.
This institutional behavior is what makes VWAP such a reliable intraday support and resistance level. The buying and selling pressure around VWAP is not random; it is driven by the systematic behavior of the largest market participants.
The VWAP Bounce Strategy
The VWAP bounce is a long-biased strategy that enters when the price pulls back to VWAP and finds support. It is one of the most reliable intraday setups because it aligns with institutional buying behavior.
Setup conditions:
- The stock is in an intraday uptrend (making higher highs and higher lows)
- The stock has been trading above VWAP for most of the session
- The price pulls back toward VWAP on declining volume
- A bullish candlestick pattern forms near VWAP (hammer, bullish engulfing, doji)
- Volume increases on the bounce as buyers step back in
Entry: Enter long when the stock bounces off VWAP with a confirming bullish candle and increasing volume. The ideal entry is as close to VWAP as possible to minimize risk.
Stop loss: Place your stop just below VWAP. If VWAP is at $50.00, your stop might be at $49.80 or $49.70. A stock that decisively breaks below VWAP during an uptrend day signals that the trend may be reversing.
Target: The prior intraday high is the natural first target. If the stock has been making new highs throughout the day, the first pullback to VWAP often produces another leg higher that tests or exceeds the prior high.
Pro Tip
The VWAP Break Strategy
The VWAP break is both a short-selling setup and a warning signal for longs. When a stock breaks below VWAP with strong volume, it signals that sellers have taken control and the average holder for the day is now underwater.
Bearish VWAP break conditions:
- The stock breaks below VWAP on increasing volume
- Prior to the break, the stock may have been bouncing off VWAP, weakening with each test
- The break candle is a strong bearish candle with a close near its low
- There is no immediate support level just below VWAP
Short entry: Enter short when VWAP breaks with volume confirmation. The stock should close a candle below VWAP, not just wick through it.
Stop loss: Place your stop above VWAP. If the stock reclaims VWAP after breaking below it, the breakdown has failed.
Target: The prior intraday low or a support level from the daily chart provides natural targets for a VWAP breakdown trade.
Important note on the PDT rule: Short selling and covering the same day counts as a day trade. Ensure you have sufficient day trades available if trading in a margin account under $25,000.
Combining VWAP with Level 2 Data
Level 2 data (the order book showing bids and asks at various price levels) provides powerful confirmation when used alongside VWAP.
When the stock approaches VWAP from above, check Level 2 for large bid orders stacking at or near VWAP. Large institutional bids at VWAP confirm that buyers are actively defending this level, increasing the probability of a bounce.
Conversely, if the stock approaches VWAP from above and Level 2 shows large ask orders sitting just above VWAP with thin bids below, the risk of a breakdown increases.
The time and sales (tape) is equally important. Watch for large prints (institutional-sized trades) occurring at or near VWAP. Large buys at VWAP with the tape showing green prints confirm institutional accumulation.
| Level 2 Signal | At VWAP | Implication |
|---|---|---|
| Large bids stacking | Approaching from above | Institutional support, likely bounce |
| Large asks sitting | Approaching from below | Institutional resistance, likely rejection |
| Thin bids below | Testing VWAP | Risk of breakdown if support fails |
| Large green prints on tape | At VWAP | Active institutional buying |
| Large red prints on tape | At VWAP | Active institutional selling |
VWAP Standard Deviation Bands
Many charting platforms offer VWAP bands (similar to Bollinger Bands but based on VWAP rather than a moving average). These bands are plotted at one, two, and three standard deviations above and below VWAP.
Upper bands represent statistically extended prices above the average. Stocks trading at the second or third standard deviation above VWAP are significantly extended and may be due for a pullback to VWAP (mean reversion).
Lower bands represent oversold conditions relative to the daily average. Stocks at the second standard deviation below VWAP may be oversold for the day and could bounce.
Trading with VWAP bands:
For gap-and-go stocks that are trending strongly, the first standard deviation band often acts as intraday support during pullbacks within the trend. The second standard deviation band serves as a profit target zone for strong trending moves.
For mean-reversion traders, entries near the second standard deviation with targets at VWAP represent high-probability setups, though the stop loss must be placed beyond the extreme to avoid being stopped out by continued momentum.
VWAP for Different Trading Styles
VWAP is versatile and applicable to multiple trading styles, not just scalping.
For scalpers: VWAP provides quick entries on bounces with tight stops. The speed of execution around VWAP setups makes it ideal for traders who target small, frequent gains.
For momentum traders: VWAP acts as the dividing line between bullish and bearish intraday bias. Above VWAP, look for long setups. Below VWAP, look for shorts or avoid longs. This simple filter eliminates many false signals.
For opening range breakout traders: VWAP confirms whether an ORB is likely to have follow-through. If a stock breaks out of its opening range and is above VWAP, the breakout is more likely to succeed because institutional buyers are supporting the trend.
For swing traders: While VWAP resets daily, some platforms offer anchored VWAP, which calculates VWAP from a specific date or event (like an earnings release). Anchored VWAP can be used as a swing trading reference point to assess whether institutional positioning since a catalyst has been bullish or bearish.
Common VWAP Trading Mistakes
Avoiding these common mistakes will significantly improve your VWAP trading results.
Trading VWAP during low volume. VWAP is only meaningful when there is sufficient volume to make the average statistically significant. During the midday lull, volume drops and VWAP becomes less reliable. Focus VWAP setups in the first 2 hours and last hour of trading.
Ignoring the trend. VWAP bounces work best in trending stocks. Buying a VWAP bounce on a stock that has been trending down all day is a low-probability trade. Always confirm the intraday trend before trading a VWAP setup.
Using VWAP in isolation. VWAP is powerful but should be combined with other factors: volume, price action patterns, Level 2 data, and relative strength. No single indicator should drive a trading decision.
Buying the VWAP breakdown. Traders sometimes try to catch a bounce at VWAP as the stock is actively breaking through it. Wait for confirmation that VWAP is holding (a bounced candle with volume) before entering.
Frequently Asked Questions
Does VWAP work on all timeframes?
VWAP is calculated from tick data and displayed on intraday charts. It is most commonly viewed on 1-minute and 5-minute charts. VWAP is not applicable to daily, weekly, or monthly charts because it resets each day. Some platforms offer weekly or monthly VWAP, but the standard daily VWAP is the most widely used.
Can I use VWAP in premarket?
VWAP can be calculated for the premarket session, but its usefulness is limited because premarket volume is thin. Most traders start using VWAP from the regular session open (9:30 AM ET) to ensure sufficient volume for a meaningful average.
What is anchored VWAP?
Anchored VWAP calculates the volume-weighted average price from a user-specified starting point rather than the beginning of the day. You can anchor VWAP to an earnings date, a breakout level, or any significant event. This provides a longer-term perspective on institutional cost basis.
How do I add VWAP to my charts?
Most trading platforms (thinkorswim, TradingView, Webull) include VWAP as a built-in indicator. Simply search for "VWAP" in your platform's indicator library and add it to your chart. No parameters need to be adjusted — the standard VWAP calculation is universal.
Is VWAP effective for options trading?
VWAP on the underlying stock chart is highly useful for timing options entries. Buying calls on a VWAP bounce or puts on a VWAP breakdown aligns your options trade with institutional price levels. However, VWAP on the options contract itself is less meaningful due to lower options volume.
Disclaimer
This is educational content, not financial advice. Trading involves risk, and you should consult a qualified financial advisor before making any investment decisions. Past performance does not guarantee future results.
Related Articles
12 chapters covering charts, indicators, risk management & more. Plus weekly trading insights.