How to Read an Income Statement: Revenue to Net Income
⚡ Key Takeaways
- The income statement flows from revenue (top line) through cost of goods sold, operating expenses, interest, and taxes down to net income (bottom line), with each level revealing different aspects of profitability.
- Gross margin reveals the fundamental economics of the business, and expanding gross margins in a growing company is one of the most bullish fundamental signals an investor can find.
- Operating income (EBIT) is arguably the most important profit measure because it reflects core business earning power without the noise of capital structure decisions or tax planning.
- Earnings quality matters as much as earnings magnitude: high-quality earnings come from recurring revenue with strong pricing power and are supported by corresponding cash flow, while low-quality earnings rely on one-time gains or aggressive accounting.
- Comparing income statements over multiple periods using year-over-year and common-size analysis reveals trends in revenue growth, margin expansion or compression, and operating leverage that single-period snapshots cannot capture.
What Is an Income Statement?
The income statement (also called the profit and loss statement or P&L) is a financial statement that summarizes a company's revenues, expenses, and profits over a specific period. While the balance sheet provides a snapshot at a single point in time, the income statement shows performance over a period of time, typically a quarter or a fiscal year.
The income statement answers the fundamental question: is this company making money? It shows how much revenue the company generated, how much it spent to earn that revenue, and what was left over as profit.
Every investor should be able to read an income statement fluently. It is the primary source for understanding a company's profitability, revenue trends, cost structure, and earnings quality. Metrics like gross margin, operating margin, EBITDA, and earnings per share (EPS) are all derived from the income statement.
The Income Statement Structure: Top to Bottom
The income statement flows from the top line (revenue) to the bottom line (net income) through a series of subtotals that measure profitability at different levels.
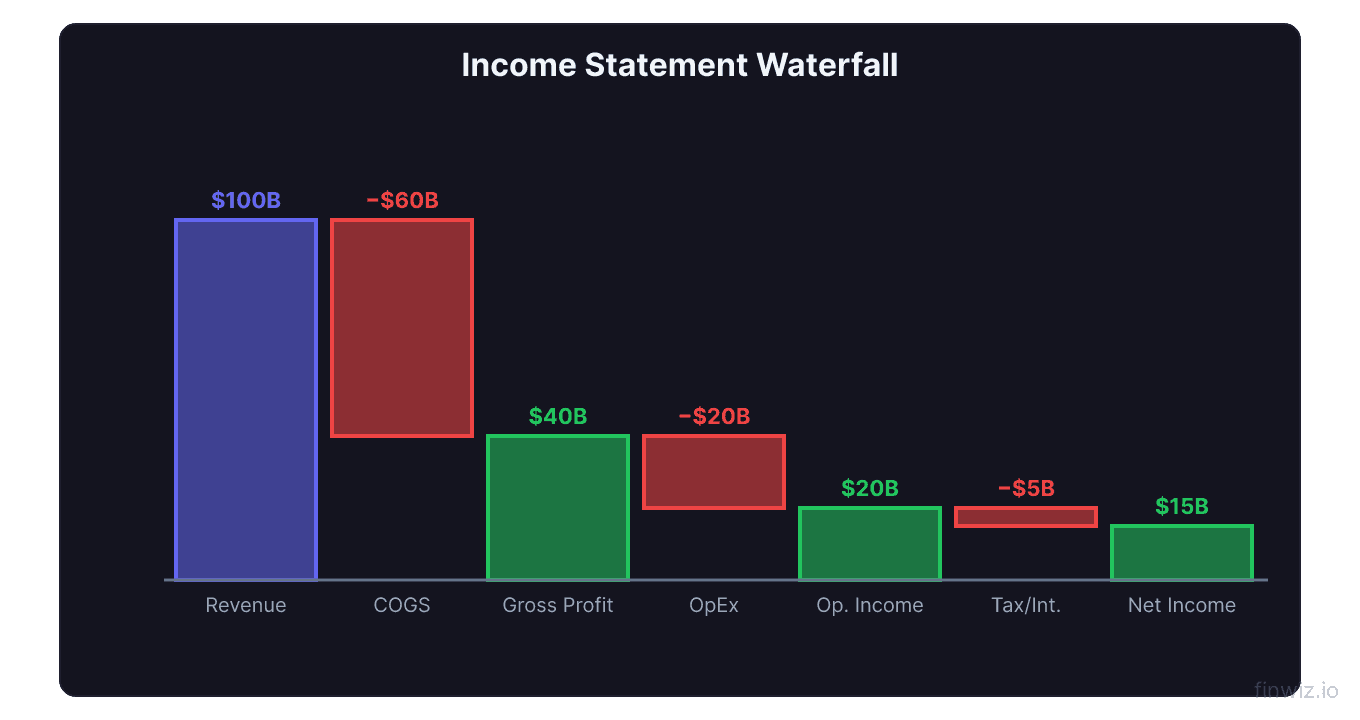
Revenue (Net Sales)Each step in this waterfall reveals important information about the business. Let us examine each line item in detail.
Revenue: The Top Line
Revenue (also called net sales or net revenue) is the total income earned from selling products or services during the period. It is called the "top line" because it appears first on the income statement.
Revenue is the starting point for all profitability analysis. Without sufficient revenue, no amount of cost management can produce sustainable profits. Revenue growth is one of the most important indicators of a company's competitive health.
Gross revenue is the total before deductions. Net revenue subtracts returns, allowances, and discounts. Financial statements typically report net revenue.
Revenue recognition is governed by strict accounting standards (ASC 606 in the United States). Companies must recognize revenue when they transfer control of goods or services to the customer, not necessarily when cash is received. This creates timing differences that investors should understand.
Pay attention to organic revenue growth versus growth driven by acquisitions. A company that grows revenue 20% but acquired a business contributing 15% only grew organically by 5%. Organic growth better reflects the health of the core business.
Cost of Goods Sold and Gross Profit
Cost of Goods Sold (COGS) represents the direct costs of producing the goods or services the company sells. Subtracting COGS from revenue yields gross profit, the first profit measure on the income statement.
What counts as COGS varies by business type. For a manufacturer, COGS includes raw materials, factory labor, and manufacturing overhead. For a retailer, it is the wholesale cost of purchased inventory. For a software company, it includes hosting costs, payment processing fees, and direct customer support costs.
Gross margin (gross profit as a percentage of revenue) is a critical metric that reveals the fundamental economics of the business. A software company with 80% gross margins has very different economics from a grocery store with 25% gross margins.
Trends in gross margin over time signal whether the company's pricing power and cost efficiency are improving or deteriorating. Expanding gross margins in a growing company is one of the most bullish fundamental signals.
Operating Expenses: SG&A and R&D
Operating expenses are the costs of running the business beyond the direct production costs captured in COGS. The two primary categories are Selling, General & Administrative (SG&A) and Research & Development (R&D).
SG&A expenses include sales force compensation and commissions, marketing and advertising costs, executive salaries and corporate overhead, rent for non-production facilities, professional fees (legal, accounting), and travel and entertainment.
R&D expenses include costs associated with developing new products, improving existing products, and advancing technology. Tech and pharma companies typically spend heavily on R&D, and investors generally view R&D as an investment in future growth rather than a pure cost.
Operating leverage occurs when operating expenses grow slower than revenue. If revenue doubles but SG&A only increases 50%, the company has positive operating leverage, and operating margins expand. This is a powerful dynamic for growth companies that have built scalable infrastructure.
| Expense Category | Examples | Key Questions |
|---|---|---|
| COGS | Materials, direct labor, hosting | Is cost per unit declining with scale? |
| SG&A | Sales team, marketing, corporate | Are these growing faster than revenue? |
| R&D | Product development, engineering | Is spending generating innovation? |
| Depreciation & Amortization | Asset cost allocation | Are capital needs increasing? |
Operating Income: The Core Metric
Operating income (also called EBIT or operating profit) is gross profit minus all operating expenses. It measures the profitability of the company's core business operations before accounting for financing costs and taxes.
Operating income is arguably the most important profit measure on the income statement because it reflects managerial efficiency and the fundamental earning power of the business, without the noise of capital structure decisions or tax planning.
Operating margin (operating income / revenue) enables comparisons across companies and over time. A rising operating margin indicates improving efficiency; a declining margin signals either pricing pressure or cost inflation.
Pro Tip
Below the Operating Line
Below operating income, the income statement captures items related to financing, taxes, and non-operating activities.
Interest expense is the cost of borrowing. Companies with significant debt will have material interest expense that reduces pre-tax income. This line item connects the income statement to the balance sheet's debt levels.
Other income and expenses includes gains or losses from investments, foreign exchange, and other non-operating activities. These items can be volatile and unpredictable.
Pre-tax income (EBT) is operating income plus or minus other income/expenses and minus interest expense. It represents total profitability before the government takes its share.
Income tax expense is the tax bill based on pre-tax income. The effective tax rate (tax expense / pre-tax income) indicates what percentage of pre-tax profits goes to taxes. This rate varies based on jurisdiction, tax planning strategies, deductions, and credits.
Net income is the bottom line: total profit after all expenses, interest, and taxes. It is the number used to calculate earnings per share and is the starting point for return on equity.
Earnings Per Share (EPS)
EPS is the most widely followed metric derived from the income statement. It divides net income by the number of shares outstanding.
Basic EPS = Net Income / Weighted Average Shares OutstandingAlways use diluted EPS for valuation because it accounts for all potential shares that could be issued through options, warrants, and convertible securities. Using basic EPS overstates per-share profitability.
EPS growth is a primary driver of stock price appreciation. Companies that consistently grow EPS at 10-20% per year tend to see their stock prices rise at similar rates over time, assuming the valuation multiple remains stable.
Non-Recurring Items and Earnings Quality
Not all earnings are created equal. Earnings quality refers to how well reported earnings reflect the sustainable, ongoing profitability of the business.
Non-recurring items that can distort earnings include restructuring charges, asset impairment writedowns, gains or losses from asset sales, legal settlement costs or gains, natural disaster costs, and acquisition-related expenses.
Companies are required to disclose these items, but they can be buried in the notes. Many companies present non-GAAP earnings that exclude these items, which can be helpful or misleading depending on management's intent.
High-quality earnings come from recurring revenue with strong pricing power, are supported by corresponding cash flow, have minimal reliance on non-recurring gains, and are not inflated by aggressive accounting choices.
Low-quality earnings rely on one-time gains to meet targets, diverge significantly from free cash flow, include aggressive revenue recognition, or repeatedly exclude "one-time" charges that occur every year.
Comparing Income Statements Over Time
The most valuable analysis comes from comparing income statements across multiple periods. This reveals trends that single-period analysis cannot capture.
Year-over-year (YoY) comparison compares the same period across years (Q3 2025 vs. Q3 2024). This eliminates seasonal effects and shows true growth trends.
Sequential comparison (Q3 vs. Q2 of the same year) reveals momentum but can be distorted by seasonality. Use cautiously.
Multi-year trend analysis (5+ years) reveals long-term direction. Plot revenue, gross profit, operating income, and net income over time. Are all four growing? If revenue is growing but net income is not, margins are compressing.
Common-size analysis expresses every line item as a percentage of revenue. This normalizes for company size and makes it easy to spot margin trends. If COGS as a percentage of revenue is rising, the company is losing pricing power or facing input cost inflation.
Frequently Asked Questions
What is the difference between the income statement and the cash flow statement?
The income statement records revenues and expenses on an accrual basis (when earned or incurred, regardless of cash timing). The cash flow statement records actual cash inflows and outflows. Revenue can be recorded before cash is received, and expenses can be recorded before cash is paid. This creates differences between net income and cash flow.
How do I find a company's income statement?
Public companies file income statements with the SEC in 10-K (annual) and 10-Q (quarterly) reports, available on the SEC's EDGAR database. Companies also include income statements in their earnings press releases and investor presentations. Financial data providers like Yahoo Finance and Google Finance display summarized income statements.
What does it mean when a company reports a loss?
A net loss means total expenses exceeded total revenues during the period. This is common for startups, growth companies investing heavily in expansion, and companies facing temporary challenges. Persistent losses without a clear path to profitability are a significant concern.
How are income taxes calculated on the income statement?
The income tax expense is based on pre-tax income multiplied by the applicable tax rate, adjusted for deductions, credits, and temporary differences. The effective tax rate shown on the income statement may differ from the statutory rate due to international operations, tax credits, deferred tax items, and tax planning strategies.
What is the most important line on the income statement?
There is no single answer, as it depends on the analysis. Revenue is most important for assessing growth. Gross profit reveals core economics. Operating income shows operational efficiency. Net income captures the bottom line. For a comprehensive analysis, examine all levels of profitability and their trends over time.
Disclaimer
This is educational content, not financial advice. Trading involves risk, and you should consult a qualified financial advisor before making any investment decisions. Past performance does not guarantee future results.
Related Articles
12 chapters covering charts, indicators, risk management & more. Plus weekly trading insights.