How to Read a Balance Sheet: Assets, Liabilities & Equity
⚡ Key Takeaways
- The balance sheet shows a company
- Equity
- Current assets and current liabilities are due within one year; long-term items extend beyond one year
- Key ratios derived from the balance sheet include current ratio, debt-to-equity, and book value per share
- Goodwill and intangible assets from acquisitions can inflate total assets without providing tangible backing
- Comparing balance sheets over time reveals trends in leverage, liquidity, and capital allocation strategy
What Is a Balance Sheet?
The balance sheet is one of the three core financial statements, alongside the income statement and the cash flow statement. It provides a snapshot of a company's financial position at a specific point in time, showing what the company owns (assets), what it owes (liabilities), and what is left for shareholders (equity).
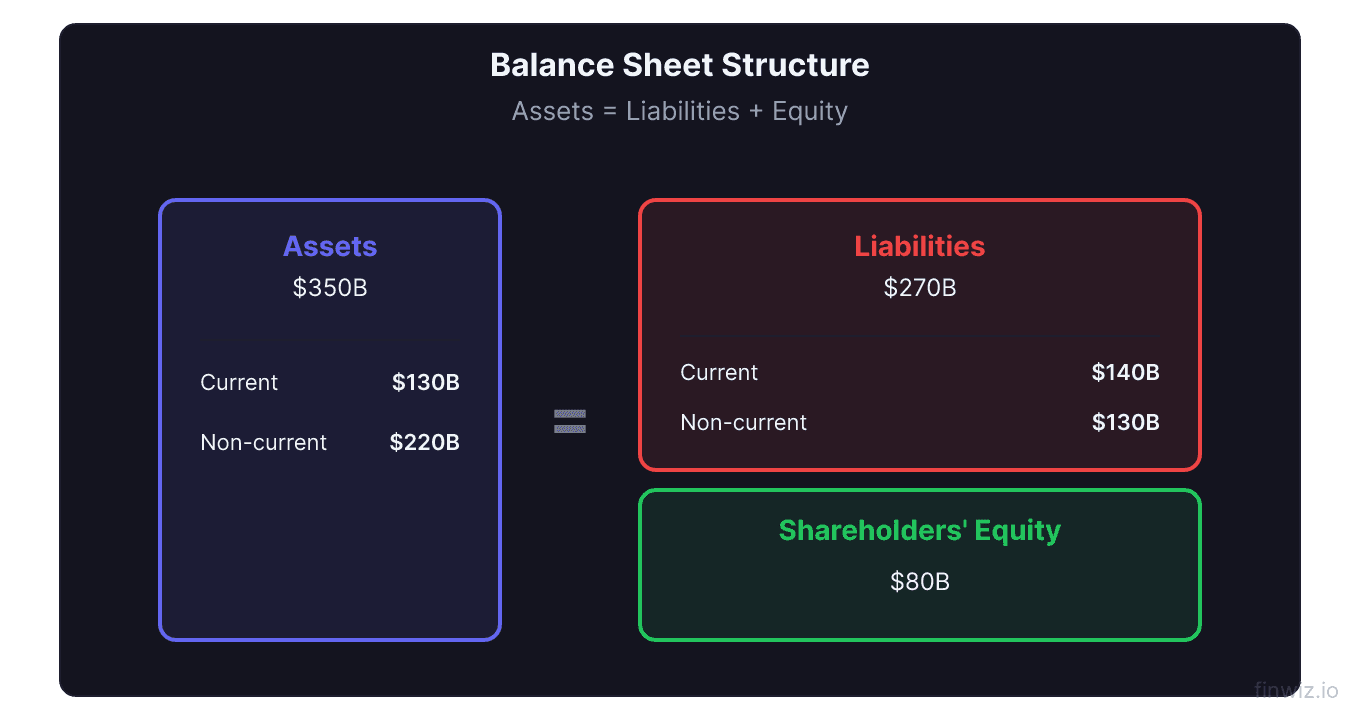
The balance sheet follows the fundamental accounting equation:
Assets = Liabilities + Shareholders' EquityUnderstanding the balance sheet is essential for evaluating a company's financial health, leverage, and liquidity. While the income statement tells you how profitable a company was over a period, the balance sheet tells you how financially strong (or fragile) it is at a given moment.
Assets: What the Company Owns
Assets represent everything of value that the company controls. They are divided into current assets (expected to be converted to cash within one year) and non-current assets (long-term resources).
Current Assets include:
- Cash and cash equivalents — Money in bank accounts and short-term investments that can be liquidated immediately. This is the most liquid asset.
- Accounts receivable — Money owed to the company by customers for goods or services already delivered. This becomes cash when customers pay.
- Inventory — Raw materials, work in progress, and finished goods held for sale. Retailers and manufacturers carry significant inventory.
- Prepaid expenses — Payments made in advance for future services (insurance, rent). These are consumed over time.
- Short-term investments — Marketable securities and other investments that can be sold within one year.
Non-Current Assets include:
- Property, plant, and equipment (PP&E) — Physical assets like factories, machinery, office buildings, and vehicles. Reported net of accumulated depreciation.
- Goodwill — The premium paid above fair market value in acquisitions. It represents intangible value like brand reputation and customer relationships.
- Intangible assets — Patents, trademarks, copyrights, and customer lists. Amortized over their useful lives.
- Long-term investments — Equity stakes in other companies, long-term bonds, and strategic investments.
Pro Tip
Liabilities: What the Company Owes
Liabilities represent the company's obligations to creditors and other parties. Like assets, they are divided into current (due within one year) and non-current (long-term).
Current Liabilities include:
- Accounts payable — Money owed to suppliers for goods and services received. This is the counterpart to accounts receivable.
- Short-term debt — Bank loans, commercial paper, and the current portion of long-term debt due within 12 months.
- Accrued expenses — Wages, taxes, interest, and other expenses incurred but not yet paid.
- Deferred revenue — Cash received from customers for goods or services not yet delivered. Common in subscription businesses.
- Current portion of long-term debt — The part of long-term debt that must be repaid within the next year.
Non-Current Liabilities include:
- Long-term debt — Bonds, term loans, and other borrowings due after one year. This is a critical number for assessing leverage.
- Operating lease liabilities — Long-term lease obligations recognized under current accounting standards.
- Pension obligations — Unfunded pension liabilities for companies with defined benefit plans.
- Deferred tax liabilities — Taxes owed in the future due to timing differences between book and tax accounting.
Shareholders' Equity: The Residual Value
Shareholders' equity represents what would be left for shareholders if all assets were sold and all liabilities were paid. It is the residual claim on the company's assets.
Key components include:
- Common stock — The par value of issued common shares (usually a nominal amount).
- Additional paid-in capital (APIC) — The amount shareholders paid above par value when shares were initially issued.
- Retained earnings — Cumulative net income that has been reinvested in the business rather than paid as dividends.
- Treasury stock — Shares that have been repurchased by the company. Reported as a negative number, reducing total equity.
- Accumulated other comprehensive income (AOCI) — Gains and losses from items like foreign currency translation and unrealized investment gains/losses.
Book Value Per Share = Total Shareholders' Equity / Shares OutstandingKey Balance Sheet Ratios
The balance sheet is the source of several critical financial ratios that measure liquidity, leverage, and financial health.
Liquidity Ratios measure the company's ability to meet short-term obligations:
| Ratio | Formula | What It Measures | Healthy Range |
|---|---|---|---|
| Current Ratio | Current Assets / Current Liabilities | Short-term liquidity | 1.5 - 3.0 |
| Quick Ratio | (Cash + Receivables) / Current Liabilities | Liquidity without inventory | 1.0+ |
| Cash Ratio | Cash / Current Liabilities | Most conservative liquidity | 0.5+ |
Leverage Ratios measure the company's use of debt:
| Ratio | Formula | What It Measures | Context-Dependent |
|---|---|---|---|
| Debt-to-Equity | Total Debt / Shareholders' Equity | Financial leverage | Varies by industry |
| Debt-to-Assets | Total Debt / Total Assets | Asset financing by debt | Lower is safer |
| Interest Coverage | EBIT / Interest Expense | Ability to pay interest | 3.0x+ is comfortable |
Efficiency Ratios measure how well the company uses its assets:
| Ratio | Formula | What It Measures |
|---|---|---|
| Asset Turnover | Revenue / Total Assets | Revenue per dollar of assets |
| Receivables Turnover | Revenue / Accounts Receivable | Collection speed |
| Inventory Turnover | COGS / Average Inventory | Inventory management |
Reading a Balance Sheet: Practical Tips
Here is a structured approach to reading and analyzing a balance sheet.
Start with the big picture. Look at total assets, total liabilities, and equity. Calculate the debt-to-equity ratio immediately. If liabilities are 80% of assets, the company is heavily leveraged. If equity is negative, the company has more liabilities than assets.
Examine the asset composition. What percentage of assets are current versus long-term? A company with 80% of assets in PP&E is capital-intensive. A company with 50% of assets in cash and receivables is asset-light. How much of total assets is goodwill?
Check liquidity. Calculate the current ratio and quick ratio. Can the company pay its short-term debts? If current liabilities exceed current assets, the company may face liquidity pressure.
Analyze the debt structure. How much debt matures in the next year versus the long-term? A company with $5 billion in debt maturing next year but only $1 billion in cash faces a refinancing risk if credit markets tighten.
Compare to prior periods. The balance sheet is most informative when compared over time. Is debt increasing or decreasing? Is the company building cash or depleting it? Are receivables growing faster than revenue (potential collection problem)?
Cross-reference with the income statement. Use balance sheet items with income statement items to calculate profitability ratios like ROE and asset turnover. These cross-statement ratios provide a more complete picture.
Current vs. Long-Term: Why the Distinction Matters
The classification of items as current or long-term has practical implications for financial analysis.
Current items (due within one year) affect short-term liquidity and working capital management. A company with $2 billion in current assets and $3 billion in current liabilities has a current ratio of 0.67, indicating potential difficulty meeting near-term obligations.
Long-term items affect the company's strategic position and capital structure. Long-term debt represents the fundamental leverage of the business. Long-term assets represent the productive capacity.
Working capital is the difference between current assets and current liabilities. Positive working capital means the company has sufficient short-term assets to cover short-term obligations. Negative working capital can be a concern, though some businesses (like large retailers) operate with negative working capital by design because they collect from customers faster than they pay suppliers.
Goodwill and Intangible Assets: Hidden Risks
Goodwill deserves special attention because it often represents a significant portion of total assets, especially for companies that have grown through acquisitions.
Goodwill is created when a company acquires another company for more than the fair market value of its identifiable assets. The excess purchase price is recorded as goodwill and represents the value of the acquired company's brand, customer relationships, workforce, and other intangible value.
The risk is that goodwill may be impaired. If the acquired business underperforms, the company must write down the goodwill, recording a large non-cash charge. This does not affect cash flow directly but reduces total assets and equity, sometimes dramatically.
Companies with goodwill exceeding 30-40% of total assets are particularly vulnerable to impairment charges. When evaluating such companies, consider whether the acquired businesses are performing well enough to justify the carrying value of goodwill on the balance sheet.
Frequently Asked Questions
How often are balance sheets published?
Public companies publish balance sheets quarterly (in 10-Q filings) and annually (in 10-K filings). The annual balance sheet is audited by an independent accounting firm, providing the highest level of assurance. Quarterly balance sheets are reviewed but not fully audited.
Can a company have negative shareholders' equity?
Yes. This occurs when accumulated losses or aggressive share buybacks cause total liabilities to exceed total assets. Companies like McDonald's and Starbucks have had negative equity due to massive buyback programs. Negative equity does not necessarily mean insolvency if the company generates strong cash flow.
What is the difference between book value and market value?
Book value is the value of shareholders' equity on the balance sheet, based on historical cost accounting. Market value (market capitalization) is the value the stock market assigns to the company's equity. Market value typically exceeds book value because it reflects future earnings potential, not just historical costs.
How do I compare balance sheets across industries?
Use ratios rather than absolute numbers. The current ratio, debt-to-equity ratio, and asset turnover ratio normalize for company size and allow cross-industry comparison. However, remember that acceptable ratio ranges vary significantly by industry. A 3:1 debt-to-equity ratio might be normal for a utility but alarming for a tech company.
What is off-balance-sheet financing?
Off-balance-sheet items are financial obligations or assets not directly reported on the balance sheet. Before accounting standard changes, operating leases were a major off-balance-sheet item. Special purpose entities, guarantees, and certain derivatives can also remain off-balance-sheet. These items are disclosed in the footnotes.
Disclaimer
This is educational content, not financial advice. Trading involves risk, and you should consult a qualified financial advisor before making any investment decisions. Past performance does not guarantee future results.
Related Articles
12 chapters covering charts, indicators, risk management & more. Plus weekly trading insights.